|
IMAP Processing Performance |
|
||||
|
|
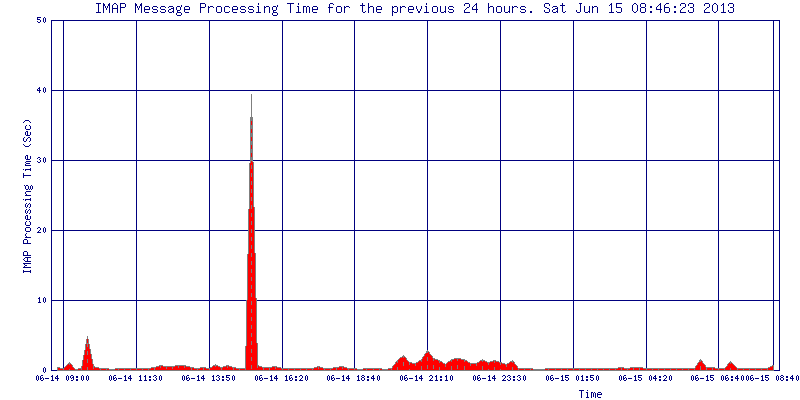
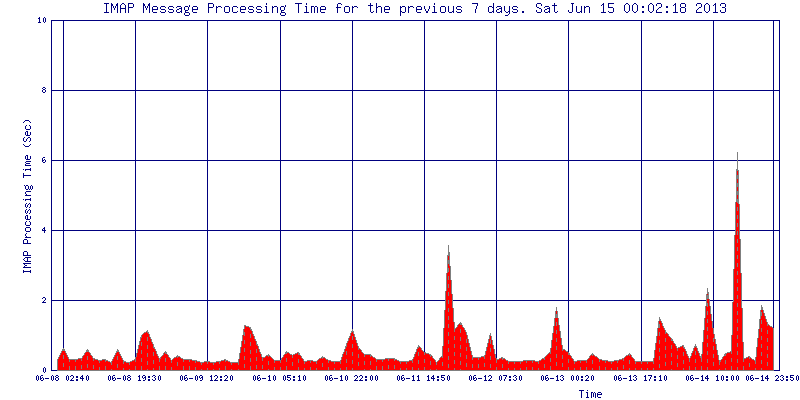
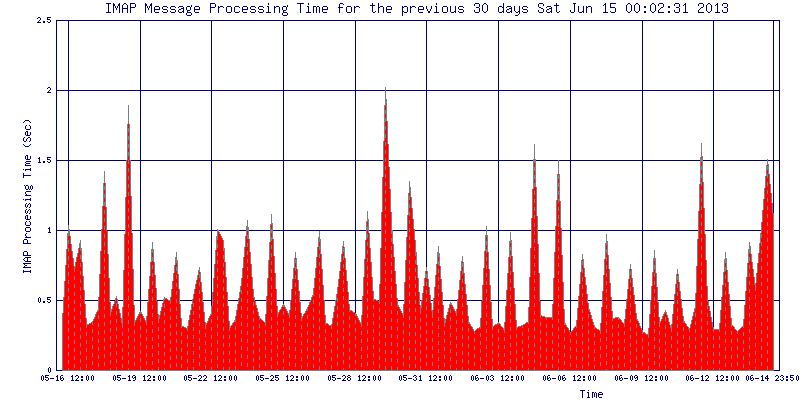
These plots show the average processing time for IMAP messages. The processing time includes the total time to connect; select an IMAP folder; download the message list, the message headers, and the messages; and deleting the messages from the folder. There are 120 plotted data points in each graph. The averaging window is adjusted to plot the displayed time range.


