|
Average Delivery Times |
|
||||
|
|
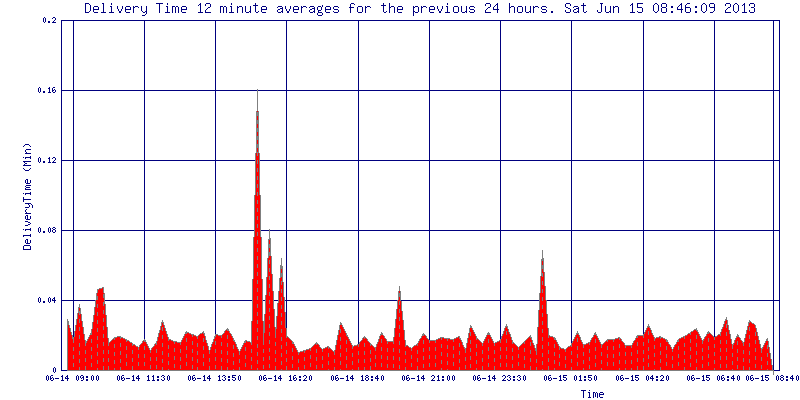
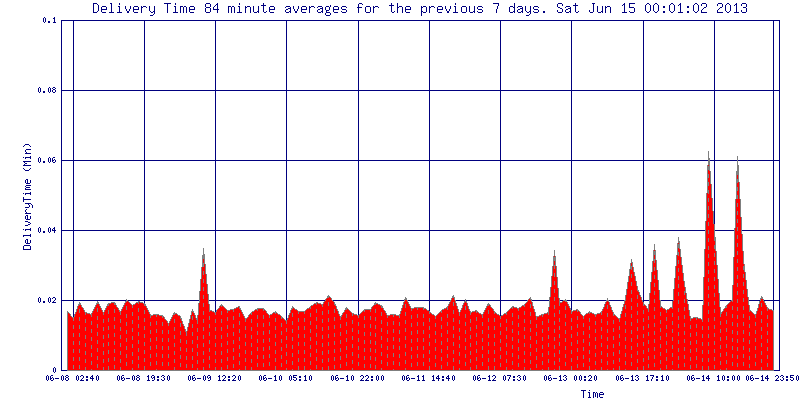
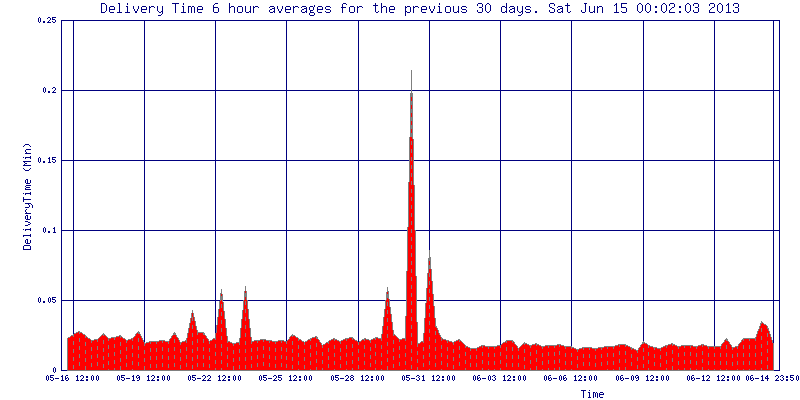
These plots show the average delivery times for injected test messages. The delivery times are averaged over the indicated window. There are 120 plotted data points in each graph. The averaging window is adjusted to plot the displayed time range.


