|
Delivery Percentage/Time |
|
||||
|
|
![]()
![]()
![]()
![]()
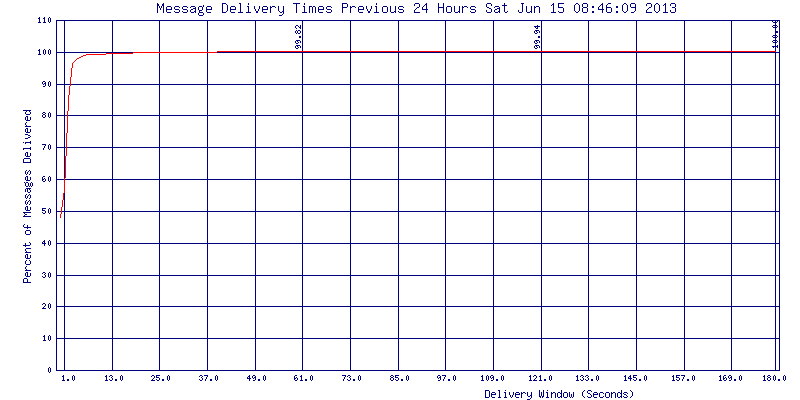
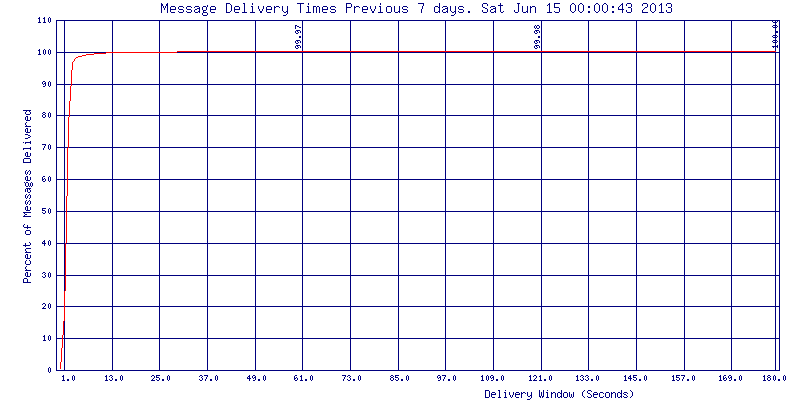
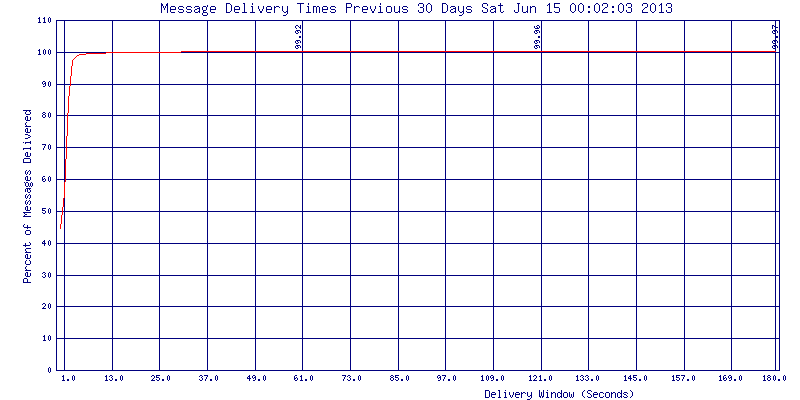
These plots show the percentage of test messages that are delivered during an increasing time window from zero to Three minutes. Critical points of one, two, and three minutes are indicated on the plots. The maximum displayed window is three minutes.
![]()
![]()
![]()
![]()